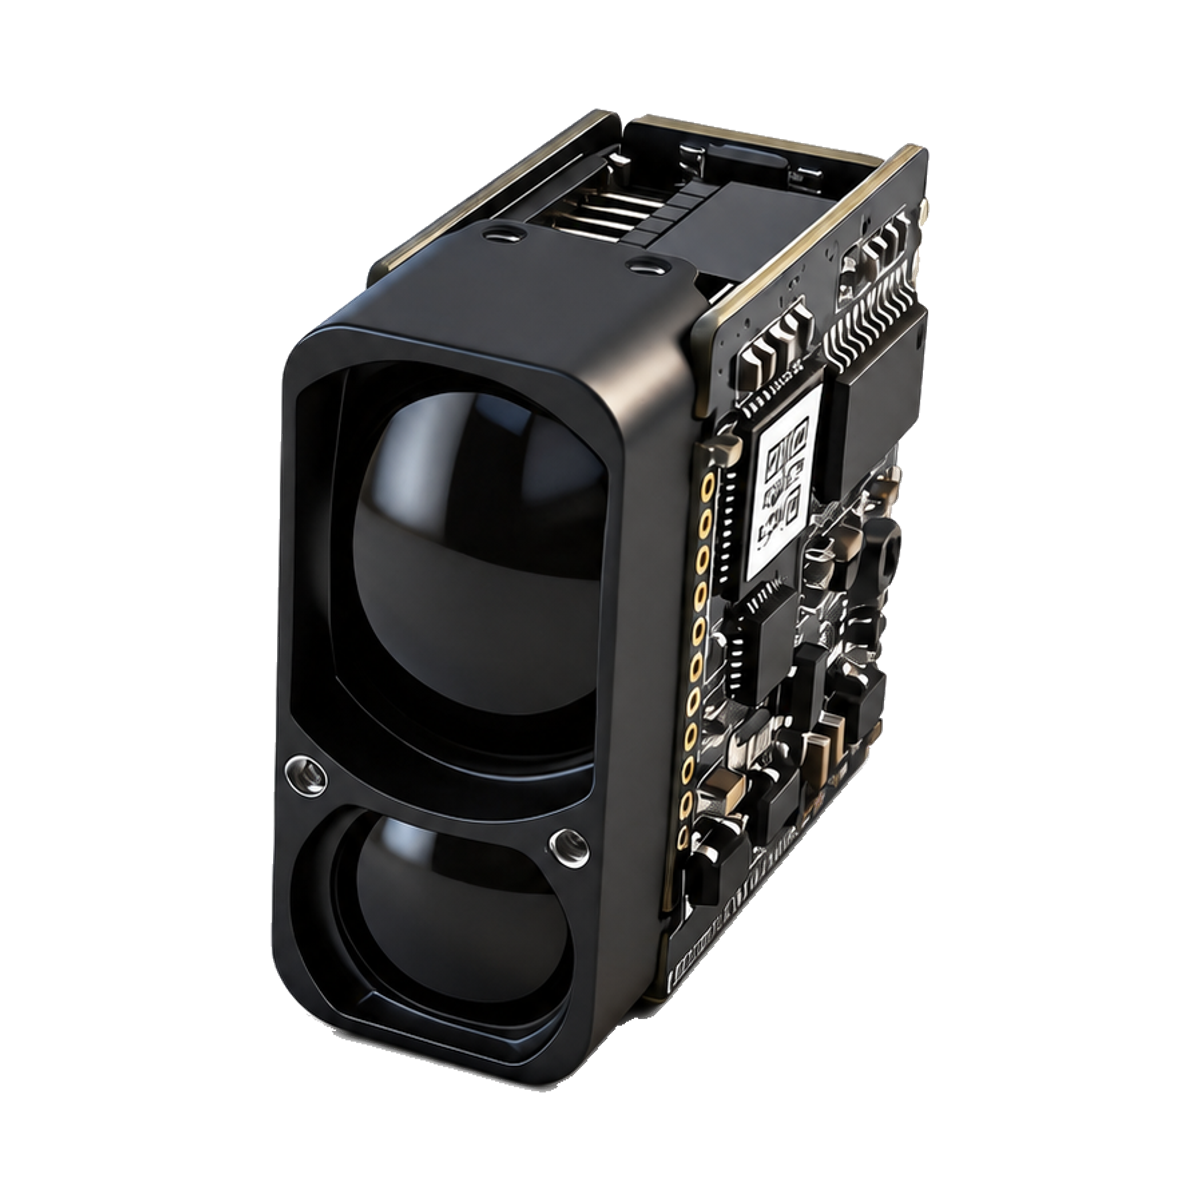
Twenty valid readings out of twenty do not establish a 98% valid measurement probability. They describe one short record. For an LR2000E2 incoming inspection, define what counts as a trial and a valid result, preserve unsuccessful attempts, and calculate a confidence bound before interpreting a perfect-looking percentage. A clean display alone cannot answer the sampling question.
Keep the model’s distance bands attached
ERDI’s documentation review on 28 September 2026 checked the LR2000E2 module entries: a ranging range of 4–2,000 m, and a valid measurement rate of ≥98% (≤400 m) · ≥80% (400–2,000 m). These are separate distance bands, not a universal 98% figure. The source notation includes 400 m in both expressions; confirm the intended boundary treatment before making an acceptance decision exactly there.
The cited rate entry does not specify the trial count, confidence level, surface reflectivity, illumination or operational definition of “valid.” Obtain the applicable test conditions and counting rule before claiming a match to that specification. The existing LR-series comparison introduces the two rates; this note adds a sampling calculation, not another model comparison.
Define the denominator before recording data
The protocol source describes STA = 1 as measurement successful and other STA values as measurement failed. That status is useful evidence, but it does not by itself demonstrate distance accuracy against an independent reference. Nor does it establish that a host’s counting rule reproduces the manufacturer’s valid-measurement-rate procedure.
For a host integration check, predefine N acquisition opportunities, their timing and a response deadline appropriate to the confirmed configuration. Log one outcome per opportunity. Keep successful reports, explicit measurement failures, malformed replies and missing replies in distinct categories. A host availability fraction can count missing replies as unsuccessful opportunities, but label it as a system metric; transport loss must not silently become a claim about the sensor’s optical performance. Counting only replies that passed the parser would hide missing data.
A calculation for an all-success record
Assume a fixed, preplanned number n of independent trials, each with the same unknown success probability p. “Success” must have the same agreed meaning throughout. All trials in this example succeed. The examples are mathematical records, not measurements on ERDILRF hardware, and apply to one defined setup rather than a production lot or every operating condition.
Under these assumptions, the probability of n successes is pn. For a one-sided 95% exact binomial lower confidence bound, set pLn = 0.05, giving pL = 0.051/n. Here 0.05 is the chosen one-sided tail probability, not a product parameter. The NIST confidence-interval reference explains exact binomial limits for small samples or few failures. The expression here is the all-success, one-sided special case derived from the binomial probability.
| Synthetic record | Observed success fraction | 95% lower bound |
|---|---|---|
| 20 of 20 | 100% | 86.09% |
| 100 of 100 | 100% | 97.05% |
| 149 of 149 | 100% | 98.01% |
All three displays say 100%, but their statistical evidence differs. Even if p were exactly 0.98, the probability of seeing twenty successes is 0.9820 ≈ 66.76%; such a run is unsurprising. To obtain a lower bound of at least 0.98 with no failures, solve n ≥ ln(0.05) / ln(0.98) = 148.28…, then round up to 149. The 0.98 benchmark comes from the model’s near-distance rate entry; it is not substituted for the far-distance entry.
This does not prescribe 149 reports as a factory acceptance test. Correlated consecutive reports do not supply 149 independent trials. Changing surfaces or pooling distance bands violates the common-probability assumption. Repeating batches until one passes also breaks the fixed sampling plan. If any trial fails, the all-success formula no longer applies: retain the complete record and use the appropriate binomial limit, or a method that accounts for dependence. A low lower bound from a small sample means insufficient evidence for the proposed threshold, not proof of a defective unit.
A usable inspection record
- Write the question. Identify whether you are checking protocol success, host availability or accuracy-qualified readings. Agree how that metric relates to the published rate before a conformance decision.
- Freeze one condition. Record unit identifier, firmware if known, distance, surface, geometry, illumination, temperature and window condition. Keep different distance bands in separate records.
- Fix the plan in advance. Record the trial count, timing, timeout rule, confidence level and handling of retries. Explain why independence is reasonable; spacing reports apart alone does not prove it.
- Retain every outcome. Save timestamps and raw replies, including failures and timeouts. Do not restart the counter after a bad result or silently remove parser errors.
- Report counts and limitations. Show successes/N, failure categories, the chosen bound and its assumptions. Leave conformity undecided when the factory conditions or metric definition remain unresolved.
For help aligning an inspection record with the model documentation, contact ERDILRF with the working distance, surface description, counting rule and a short raw log.